This story was written by Sarah Hansen and first appeared on news.umbc.edu
The solar cycle involves periodic changes in activity on the Sun’s surface, and a new way of thinking about it reveals connections between solar activity and weather patterns on Earth. New research in Earth & Space Scienceled by Robert Leamon, research scientist at the Goddard Planetary Heliophysics Institute, a UMBC partnership with NASA, describes the discovery of a solar cycle phenomenon the authors have dubbed “the terminator.”
The researchers found that a La Niña weather pattern in the Pacific Ocean quickly follows a terminator event. La Niña and El Niño patterns affect everything from the likelihood of severe hurricanes to the success of the growing season. This means the ability to predict these patterns on the scale of about a decade could help communities and governments prepare for natural disasters, shifting crop supply and prices, and more. Organizations like NOAA currently offer weather pattern predictions about one year out, but access to decade-scale forecasts would be a huge advance.
Robert Leamon. Photo courtesy Robert Leamon.
The terminator
Leamon and co-authors Scott McIntosh and Daniel Marsh, both at the National Center for Atmospheric Research, define the terminator as the precise point where any remnants of activity from the previous cycle disappear from the sun’s surface. After “termination,” there is a dramatic increase in solar activity in the new cycle. Activity associated with two consecutive cycles usually overlaps for a few years, but the two cycles’ sunspots are distinguishable from each other based on their magnetic polarity (north vs. south). The polarity of the Sun reverses direction each cycle.
Previously, scientists defined the transition from one solar cycle to the next as the “solar minimum,” where overall solar activity is at its lowest point. However, this definition is imprecise. The terminator gives researchers a new way to think about the end of the solar cycle, and a more precise way to predict the timing of ensuing weather patterns.
Based on continuously collected cosmic ray data from an observatory in Finland, the new study demonstrates that a terminator event has consistently occurred about one year after the traditional “solar minimum” during each solar cycle for the last 60 years. In fact, data in the paper, which has been in the works since 2017, accurately predicted the next La Niña in 2020.
The name for the phenomenon was an easy choice, according to Leamon. “We’ve been calling this the terminator for a few years, because it indicates the death of a solar cycle,” he says. “And, because it’s predictable, it will, as always, ‘be back.’”
A “cycling” solution
Not all solar cycles are exactly the same length. They can range from about nine to 14 years, averaging around 11 years. So, Leamon used a creative, athletics-inspired technique to compare the timing of the sequence of events in each cycle. When reviewing his stats from a 100-mile bike ride in 2017, he noticed that each 25-mile lap got a little slower, but there were always the same speed-ups and slow-downs around certain features on the course, like hills. So, if he plotted the laps by distance, rather than time, all the hills lined up. Why not do the same for the solar cycle?
Using a GPS watch to track a 100-mile bike race inspired the technique Robert Leamon employed in his new research. Here he competes in an Ironman triathlon. Photo courtesy Robert Leamon.
While the solar cycle doesn’t technically have a “distance” measurement, it’s possible to divide the length of each sun cycle into 100 equal parts, then plot the cycles on top of each other to compare their features.
“It’s one of those things… You just have a moment of inspiration and think, why don’t I try that?” Leamon says. “That’s how this study came to be. Rather than plotting the cycles by time, do it as distance.” And when you do that, he says, “all sorts of things start to line up.”
Hidden signals
This technique revealed that the transition away from the solar minimum is quite abrupt, rather than the smooth curves depicted in many explanatory charts of the solar cycle. “It’s not a smooth transition. There’s actually a sharp jump in solar activity and a sharp drop in cosmic rays right when solar activity picks up,” Leamon explains.
The relative abundance of cosmic rays entering Earth’s atmosphere is one of the ways that scientists can measure solar activity. When solar activity is limited, the magnetic fields associated with Earth and the Sun are simple and largely aligned. That creates an uninterrupted path for more cosmic rays to reach Earth. However, with high solar activity, the magnetic fields are complex. “Swiss cheese is perhaps a good analogy,” Leamon says. “There’s more stuff to scatter incoming particles off of. So at solar maximum, there’s a smaller number of cosmic rays hitting the Earth.”
Other researchers may have considered the irregular increase and decrease of solar activity as just noise in the data, but mapping the cycles by “distance” allowed Leamon to see that it was a consistent phenomenon. “One man’s noise is another man’s signal,” he says with a smile. “So don’t over-smooth things,” he says, or you’ll risk missing essential information.
Think outside the sky
Leamon acknowledges a concern that some people will try to use his study as evidence that climate change is caused by the Sun, not humans. That argument has long been made by deniers of human-caused climate change. But Leamon is clear that it misinterprets his findings.
When we talk about global warming, he says, “we’re only talking about the troposphere—the bottom few miles of the atmosphere where we live. But one of the consequences of a warming troposphere is a colder stratosphere,” which extends about 32 miles above Earth’s surface. By keeping more heat closer to the surface, that heat doesn’t escape and warm the stratosphere—and a colder stratosphere intensifies the solar cycle changes by increasing electrical conductivity in the upper atmosphere.
In fact, “since the 1950s there’s been a noticeable cooling of the stratosphere to go along with the warming of the troposphere,” Leamon says. That correlates with the beginning of seismic shifts in the U.S. standard of living, energy use, and other factors that have contributed to human-caused climate change. So, it’s fair to say that the Sun is a factor in the climate, but its role has intensified because of human activity, Leamon explains.
Science for the people
Leamon has additional research under review that offers further details about events during the solar cycle. His upcoming work also takes advantage of the new way of looking at the data inspired by his bike ride. Combined with the current results, the goal is to generate knowledge that both satisfies our innate curiosity about the workings of the solar system and helps people and communities navigate a changing world.
“If further research can establish that changes on the Sun are truly causing variability in the oceans, then we may be able to improve our ability to predict El Niño and La Niña events,” Leamon says.“That could help us understand how the Earth system varies on the scale of a season to a decade, and how predictable those variations are—giving us a firmer grasp on the complex bridge between weather and climate.”
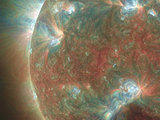
Banner image: An image of a terminator event on the Sun in 2011. The three different colors (added by researchers) represent three temperatures. Photo courtesy of NASA Solar Dynamics Observatory.
- Attached Photo for UMBC-led research connects solar cycle, climate predictions
- Attached Photo for UMBC-led research connects solar cycle, climate predictions
- Attached Photo for UMBC-led research connects solar cycle, climate predictions
- Attached Photo for UMBC-led research connects solar cycle, climate predictions
- Attached Photo for UMBC-led research connects solar cycle, climate predictions
Posted: April 7, 2021, 1:48 PM